Data Center Design That Works: A Practical 2026 Guide
A CIO inherits a mixed environment: aging air-cooled racks, a colocation contract nearing renewal, an AI program asking for far more power density, and a utility milestone nobody can explain clearly. Every vendor claims its architecture is resilient, efficient, and ready to scale. The difficult questions sit outside the brochure. Can the site receive power when the business needs it? Can the cooling plant support tomorrow's racks without making today's equipment unserviceable? Can the team prove that a redundant design works during maintenance, faults, and human error?
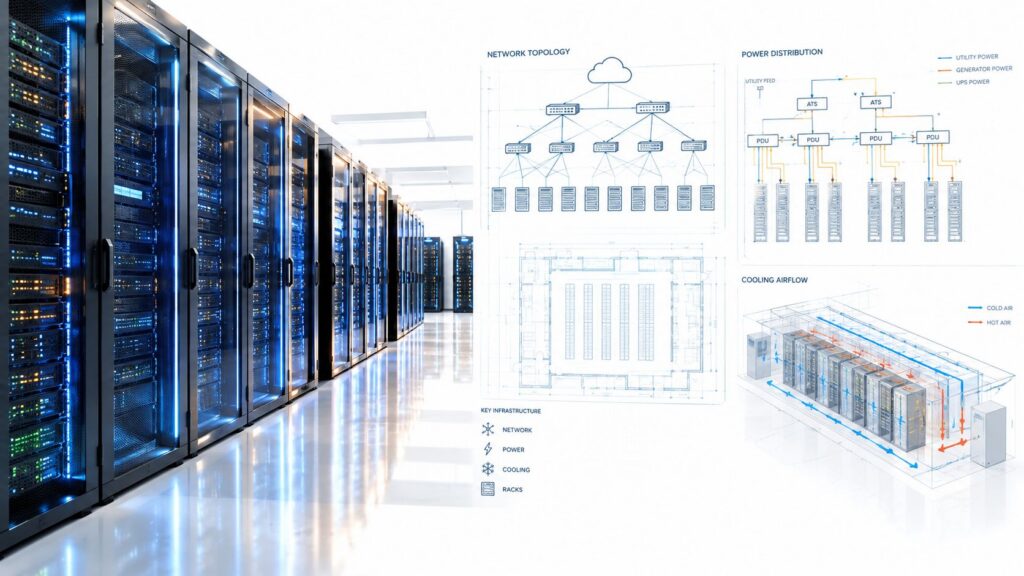
Data center design works when those constraints are decided together. Power, thermal performance, availability, network topology, security, water impact, and commissioning belong in one operating model. Locking the topology first and postponing grid access or retrofit governance is how organizations buy an impressive facility that arrives late, costs more to run, or cannot support the workloads it was intended to host.
Starting With Requirements Before You Draw Anything
A CIO taking over a modernization program often receives a floorplan before receiving a defensible business case. The equipment list is incomplete, application owners disagree about recovery needs, and the colocation proposal assumes a growth curve nobody has approved. The engineering team can solve technical problems, but it can't resolve requirements that finance, security, operations, and business leaders haven't aligned.
Start with a workload inventory, not a room layout. For each application, document its compute profile, storage behavior, network dependencies, latency sensitivity, data-residency obligations, maintenance window, and expected growth. Separate steady workloads from bursty ones, and identify which systems need dedicated hardware, specialized accelerators, or proximity to users and data sources.

Turn business tolerance into design inputs
Recovery objectives need owners. The application leader should approve the recovery-time objective, the data owner should approve the recovery-point objective, security should define control requirements, and finance should validate the interruption-cost assumptions. If nobody owns a requirement, it will become a negotiation during construction.
Your discovery workshop should answer:
- Workload profile: Which systems are CPU-heavy, storage-heavy, network-intensive, or unusually dense?
- Growth logic: What is expected to grow, what may be retired, and what requires a reserved expansion path?
- Location constraints: Which workloads face latency, sovereignty, residency, or jurisdiction requirements?
- Operating model: Who performs maintenance, approves changes, responds to alarms, and controls vendor access?
- Financial tolerance: What operational disruption can the business absorb, and what recovery investment does that justify?
- Exit conditions: What would make the organization leave a facility, provider, or architecture?
A hybrid or multi-cloud strategy may be part of the answer, but it should follow workload decisions rather than replace them. Teams comparing placement options can use this multi-cloud strategy guidance to frame portability, interconnection, governance, and provider dependencies before they commit to a physical footprint.
Write a brief that vendors can't reinterpret
Condense the discovery work into a short design brief. It should state the required workload classes, target rack densities, availability objectives, connectivity needs, security controls, data-location rules, expansion assumptions, commissioning evidence, and utility schedule. Include an owner beside every requirement and identify which items are mandatory, preferred, or negotiable.
That document also gives you a fair way to compare conventional construction, colocation, and modular approaches. If speed, phased capacity, or repeatable deployment matters, why modular construction transforms data centers offers useful context for evaluating modular methods without treating them as a universal answer.
The brief should be specific enough that an architect, broker, or colocation sales engineer can't hide a gap behind terminology. Ask for evidence, not adjectives. “Concurrent maintenance demonstrated through integrated systems testing” is useful. “Highly resilient” is not.
Setting the Right Availability Target for Your Workloads
Availability is a budget conversation disguised as a technology conversation. A business that can restore a service from a known backup doesn't need the same topology as a trading, clinical, or manufacturing system that cannot tolerate interruption. Select the target after classifying the workload, not after a vendor presents the highest tier available.
Start with RTO, RPO, and business impact
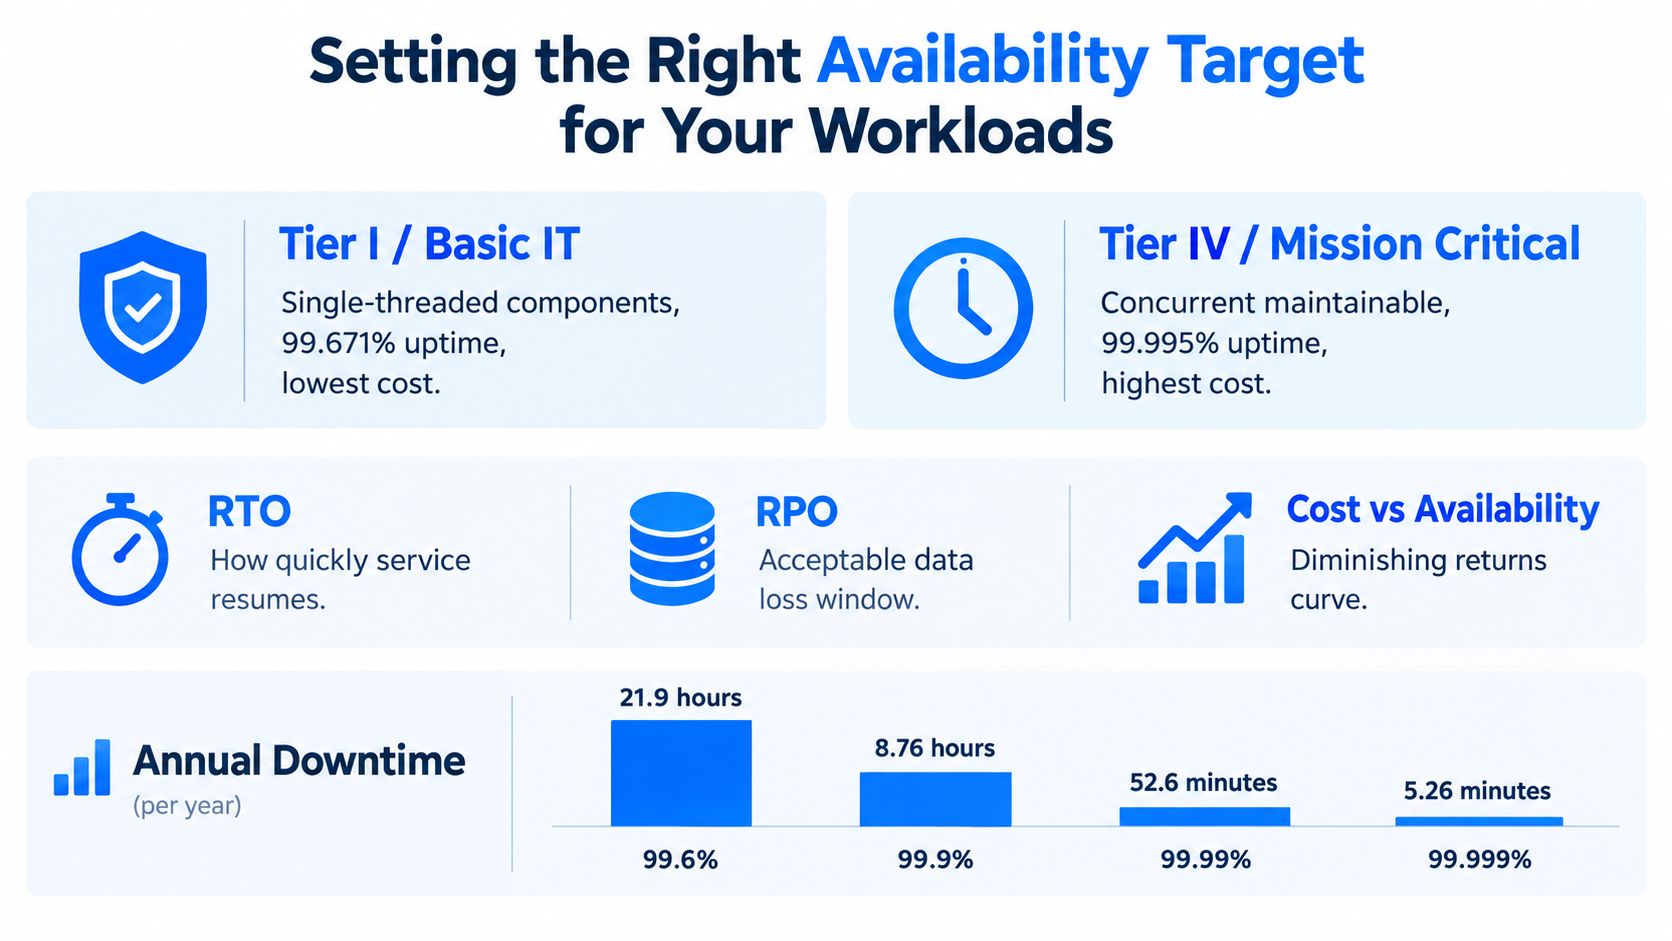
Recovery-time objective defines how quickly service must resume. Recovery-point objective defines how much recent data the business can lose. Those values should sit beside a practical interruption-cost assessment, including lost transactions, regulatory exposure, safety consequences, customer impact, manual-work costs, and reputational damage.
Published Uptime Institute tier figures commonly associate Tier I with 99.671% availability and about 28.8 hours of annual downtime, Tier III with 99.982% and about 1.6 hours, and Tier IV with 99.995% and about 26 minutes. These figures are design targets, not promises, and they should be read against the workload's actual tolerance. (Uptime Institute tier figures)
A Tier I topology may fit basic systems with recoverable workloads and generous maintenance windows. Tier III can make sense when the business needs concurrent maintainability without paying for full fault tolerance across every subsystem. Tier IV belongs where the cost of interruption justifies the added complexity, testing burden, and operating discipline.
Redundancy must survive a failure path
N+1 is often sensible because it provides a spare component while keeping capital and maintenance complexity under control. 2N can be appropriate for critical paths, but duplicated equipment doesn't automatically remove a single point of failure.
Look beyond module counts. Trace the entire path through utility service, generators, UPS systems, switchgear, distribution, cooling plants, controls, fire protection, network entry, fuel systems, and maintenance bypasses. Two UPS modules connected to one shared bus remain vulnerable to that bus. Two cooling units controlled by one failed system can create the same outcome.
Practical rule: Require the design team to demonstrate what happens when each critical component is unavailable, under maintenance, and restored.
Acceptance should include failure-mode testing, transfer behavior, maintenance bypass operation, alarm handling, and documented operator actions. The test plan should name the expected result, the evidence to collect, and the person authorized to accept the outcome. Training and procedures matter as much as installed equipment because operators can defeat a resilient topology through an unsafe sequence or an undocumented dependency.
Don't purchase availability as a percentage on a slide. Purchase a tested operating behavior that matches the applications finance and business owners have agreed to protect.
Power and Thermal Design From Utility to Rack Inlet
A utility upgrade can pass inspection and still leave an AI rack short of usable power or cooling. Design the chain from the grid connection to the rack inlet, then test its weakest operating condition. Trace capacity through switchgear, generators, UPS systems, distribution panels, busways, and rack power. Confirm that the cooling plant can reject the heat produced by the delivered IT load. A component that looks adequate alone can become the rack-level constraint.
Electrical drawings should identify normal and maintenance paths, fault boundaries, protection coordination, grounding, monitoring, and expansion provisions. Specify meters where operators need to allocate load, verify efficiency, and investigate faults. Teams reviewing distribution equipment can use this reference on a commercial electrical panel for panel, meter, and service considerations. The project still requires a facility-specific electrical study.
Design around the inlet, not the room average
The U.S. Department of Energy recommends 65 to 80°F, or 18 to 27°C, as the inlet-temperature range for data-center equipment. Its guidance also identifies wider ASHRAE allowable conditions, including approximately 59 to 90°F, or 15 to 32°C, for Class A1, and 50 to 95°F, or 10 to 35°C, for Class A2 equipment. (DOE data-center design guide)
| Equipment Class | Recommended Inlet Range | Allowable Range | Design Implication |
|---|---|---|---|
| Class A1 | 18 to 27°C | Approximately 15 to 32°C | Keep routine operation within the recommended envelope and reserve allowable limits for controlled conditions |
| Class A2 | 18 to 27°C | Approximately 10 to 35°C | Confirm equipment specifications and manage wider conditions without using them as the normal setpoint |
Model heat output at rack level. Account for supply and return airflow, bypass air, recirculation, perforated-tile placement, containment, and cable obstructions. Measure representative rack inlets at the top, middle, and bottom. Commission controls against the worst measured inlet, not the room-average setpoint.
Blanking panels, hot-aisle and cold-aisle containment, calibrated airflow, variable-speed fans, and correctly placed sensors can matter more than a larger chiller nameplate. Avoid unnecessary humidification when the facility can maintain required conditions without it.
Read PUE without accepting marketing shorthand
Power Usage Effectiveness divides total data-center facility energy by energy consumed by IT equipment. A PUE of 1.0 means every unit of facility energy supports computing, with no cooling, distribution, lighting, or other overhead. (U.S. Department of Energy PUE guidance)
Historical comparisons require original sources and clear measurement boundaries. A 2006 study estimated that 85% of data centers had a PUE above 3.0, while about 5% achieved 2.0 or lower. Uptime Institute's 2024 global survey reported an industry-average PUE of 1.56. Those figures describe different periods and survey methods, so do not present them as a like-for-like performance trend.
Treat water use as a design constraint alongside PUE. A lower electrical overhead can involve cooling-water consumption, local utility limits, treatment requirements, and exposure to drought restrictions. Require the design team to document the water source, seasonal operating assumptions, discharge obligations, and the retrofit path if the site later adds liquid cooling.
Ask how PUE was measured, over what operating period, under which load conditions, and whether construction or uncommissioned systems distort the result. Set a baseline that finance and operations can reproduce, then govern it through commissioning reviews and lifecycle retrofit decisions. A defensible measurement is more useful than a promotional target.
Rack Layout, Network Topology, and Outside-Plant Connectivity
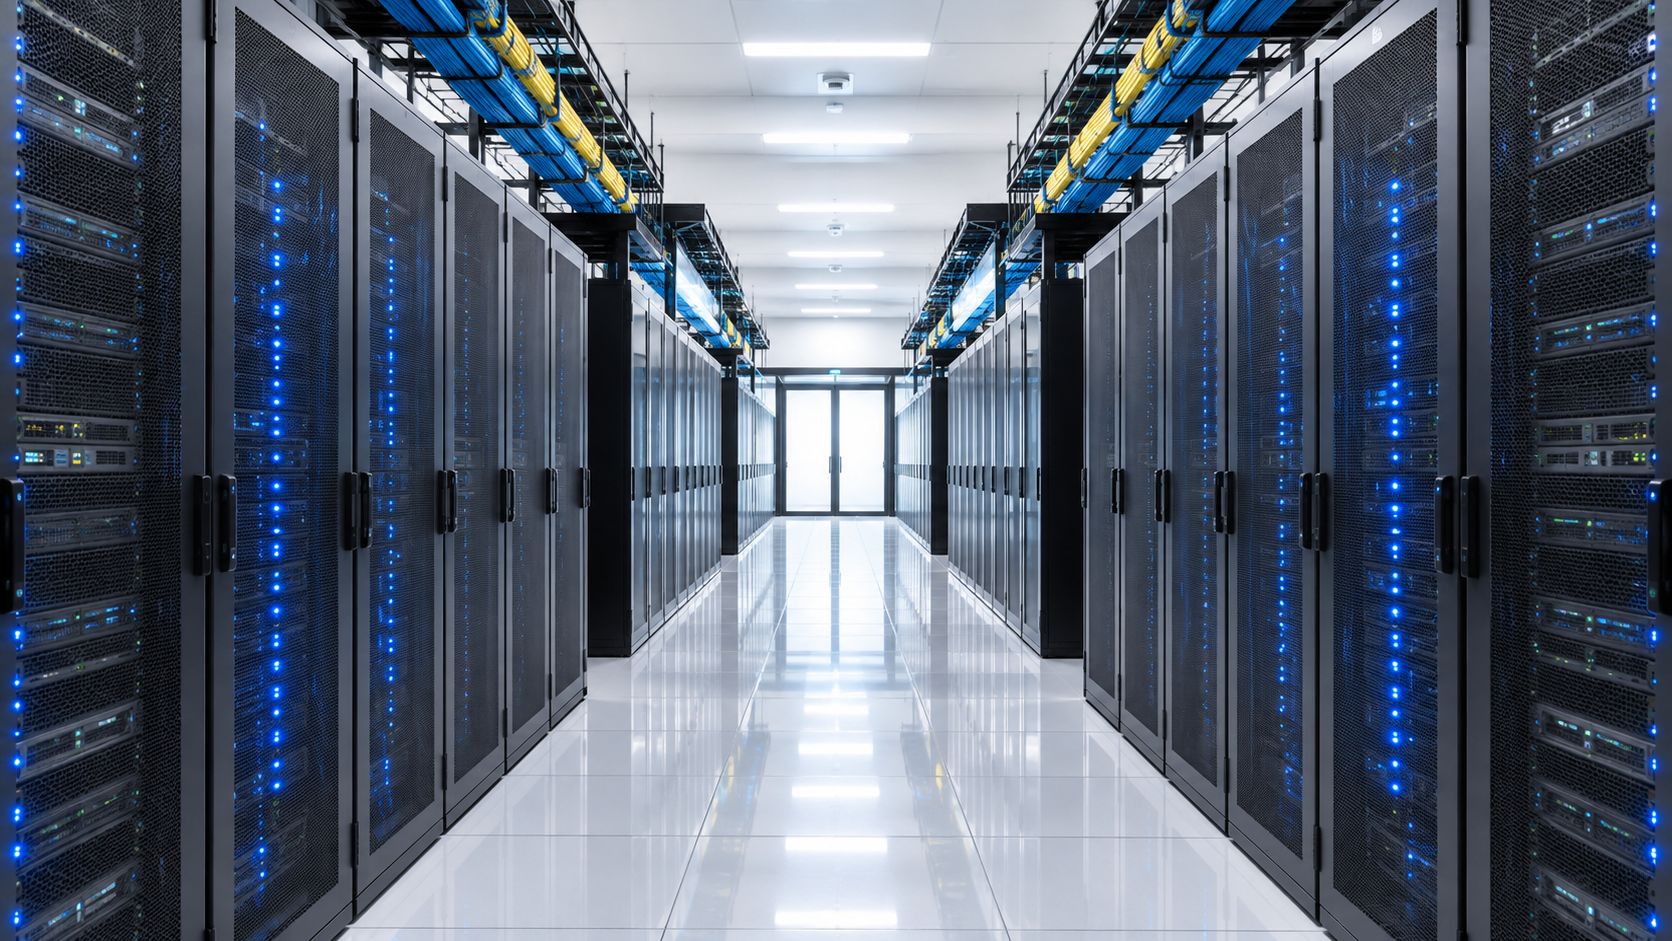
Rack layout, network fabric, and carrier connectivity should appear on the same design page. A rack plan that ignores cable pathways creates congestion. A spine-leaf design without adequate fiber routes creates an operational constraint. A carrier plan without diverse entry paths leaves the facility dependent on a shared physical failure point.
Standardize rack dimensions, power locations, patching zones, service clearances, and labeling before equipment arrives. Reserve pathways for fiber and copper separately where practical, and define how new rows will connect without disturbing live systems. Containment should align with the rack orientation and airflow design, not be added after aisle congestion appears.
Draw the fabric and the building together
Spine-leaf topology suits east-west traffic patterns common in distributed applications, virtualization, and clustered workloads. Define oversubscription, failure domains, port speeds, optical paths, management networks, storage fabrics, and out-of-band access based on the workload brief. Don't let a server vendor's preferred architecture become the enterprise standard by default.
The outside plant needs equal attention. Identify meet-me rooms, carrier entrances, diverse duct paths, demarcation points, cross-connect ownership, dark-fiber options, and restoration responsibilities. “Multiple carriers” is not enough if they enter through one conduit or depend on the same upstream route.
Make hybrid connectivity explicit
Dedicated interconnects, routing policy, security inspection, DNS governance, and workload portability should be designed before migration. SD-WAN can simplify policy and path selection across sites and cloud connections, while traditional enterprise networking remains important inside facilities and for deterministic local services. These technologies complement each other when their boundaries are clear. They create confusion when SD-WAN is treated as a substitute for physical diversity or sound routing design.
Use SD-WAN design guidance to frame the overlay decisions, then validate them against the physical topology. The result should show where traffic enters, where it is inspected, how it reaches cloud providers, and what continues operating when a carrier, fabric element, or interconnect fails.
Cooling Strategy for Mixed and AI-Dense Environments
An AI cluster can outgrow a room's cooling design before the facility team finishes its next expansion plan. JLL reports that AI rack densities are pushing beyond 150 kW per rack, making liquid cooling necessary to maintain acceptable efficiency at those densities. (JLL Data Center Outlook 2025)
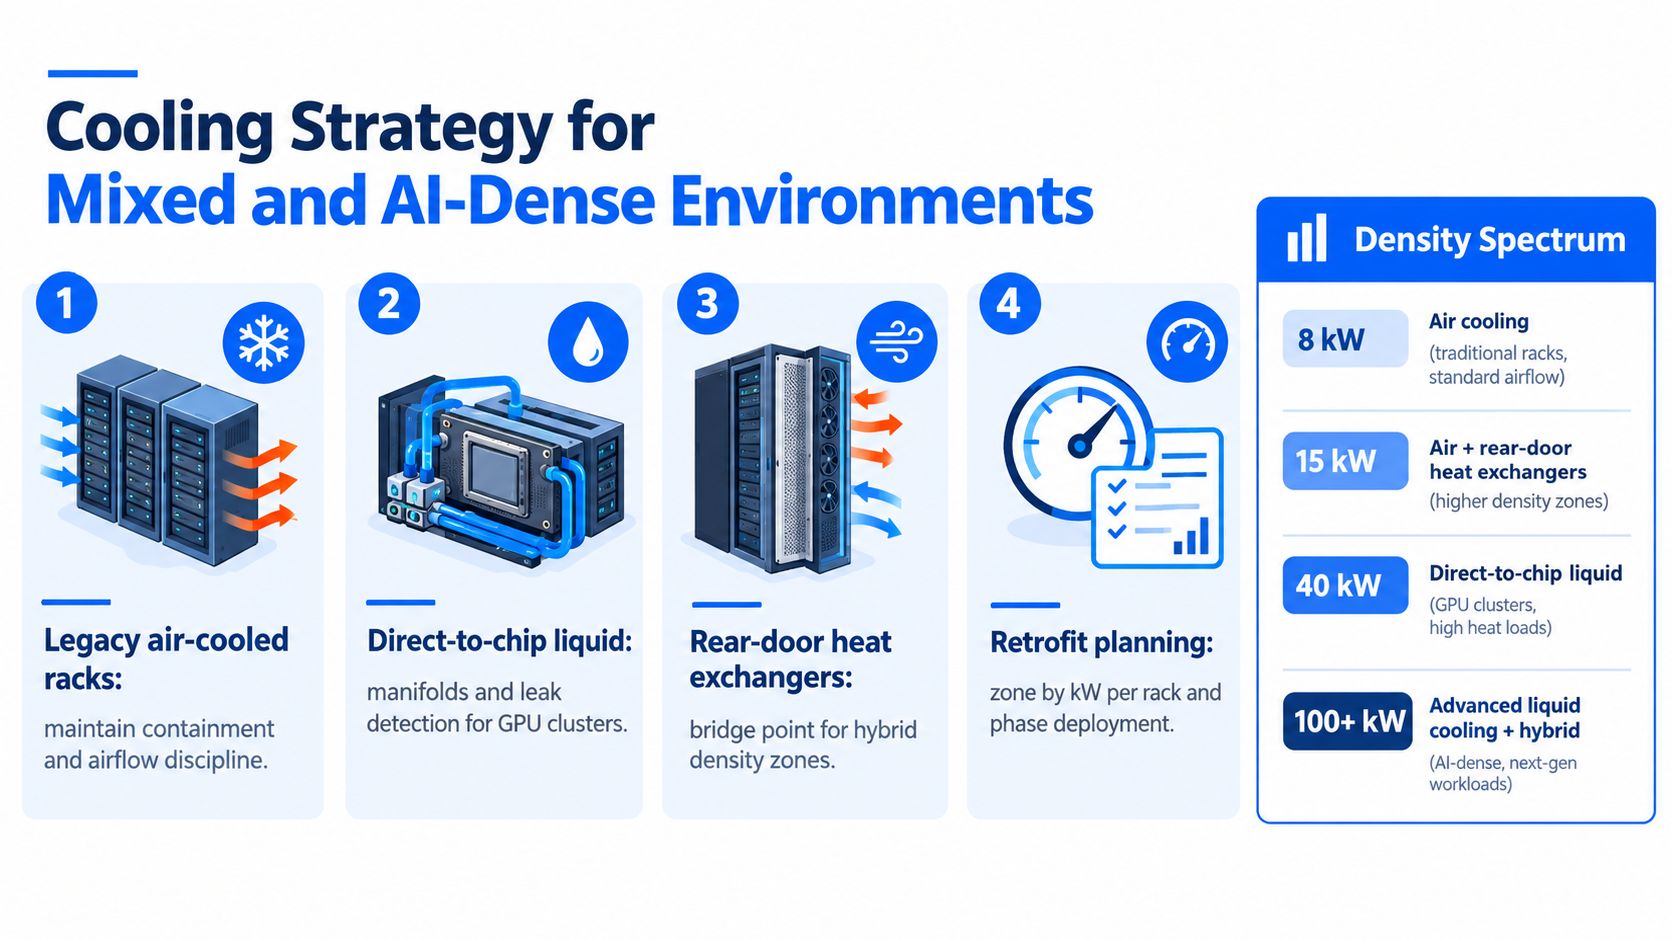
The hard decision is supporting that cluster beside legacy air-cooled racks for years. Direct-to-chip systems, rear-door heat exchangers, and immersion may all coexist in one facility, but only if the design sets clear zones, service boundaries, and retrofit rules from the start. Treat cooling water, grid readiness, and lifecycle governance as architecture constraints, not plant-room details.
Zone the facility by density and service model
Keep ordinary air-cooled racks in zones where containment and disciplined airflow can handle the load. Use rear-door heat exchangers as an intermediate option when rack density exceeds room-air capability but a full liquid distribution system is not yet justified. Direct-to-chip liquid suits concentrated accelerator clusters, provided the facility includes manifolds, coolant distribution units, leak detection, water chemistry controls, maintenance procedures, and named ownership for spare parts.
Immersion can fit specialized deployments, but it changes hardware handling, fluid management, maintenance, and vendor dependence. Approve it as an operating model, not just a cooling appliance.
Build the roadmap around these decisions:
- Density bands: Map current and expected rack heat output by zone, reserving expansion capacity for the highest-demand workloads.
- Workload priority: Place workloads with the clearest performance or density case into liquid-cooled zones first.
- Retrofit boundary: Define which pipes, CDUs, controls, floor systems, and electrical paths can be added without interrupting live racks.
- Service responsibility: Assign ownership for leaks, coolant quality, component replacement, training, and incident response.
- Measurement plan: Track PUE alongside water-use effectiveness, carbon intensity, drought exposure, and resilience requirements.
Optimize resources, not one headline metric
Cooling decisions affect electricity and water at the same time. A 2025 regional analysis of Oregon and Washington examined how building-system choices affect both resources. (regional cooling energy and water analysis)
The lowest-energy design may carry unacceptable water exposure in a constrained region. A water-saving design may increase grid dependence or carbon exposure. Review local water availability, permitting, climate conditions, grid carbon, backup operation, and maintenance access before approving the cooling plant. Confirm that the utility can support the intended density and that future retrofit work will not create an unmanageable outage or service burden.
Design position: Approve a cooling system only when it supports the density roadmap, remains serviceable during retrofit, and meets the site's water, carbon, grid, and resilience constraints.
Security, Compliance, and the Vendor Selection Question
Security belongs in the facility decision from the first site review. Physical access, logical segmentation, evidence collection, and provider accountability will all be tested during an audit or incident. A secure cage can't compensate for weak identity controls, and a strong firewall can't compensate for uncontrolled visitor access or undocumented maintenance.
Use layered physical controls: perimeter protection, monitored entry, badge governance, visitor escorting, camera coverage, mantrap or vestibule controls where appropriate, locked cabinets, and documented media handling. A practical data center physical security guide can help teams structure the physical-control discussion before they compare providers.
Compare build and colocation on the same scorecard
| Decision factor | Build | Colocation |
|---|---|---|
| Control | Direct control over architecture, procedures, and expansion | Control is shared with the facility operator |
| Speed | Dependent on land, permits, construction, and utility delivery | Can provide an existing operating environment, subject to available capacity |
| Capital model | More direct ownership and long-term responsibility | Shifts much of the facility burden into a service agreement |
| Compliance evidence | Organization builds and maintains the evidence set | Provider evidence must be reviewed, scoped, and supplemented |
| Flexibility | High architectural freedom, with high delivery responsibility | Faster access, with contract and facility constraints |
Ask each provider for actual evidence of maintenance procedures, incident escalation, access logging, testing, environmental monitoring, network diversity, and subcontractor governance. Map controls to the obligations that apply to the workload, whether that includes HIPAA, PCI DSS, SOC 2, ISO 27001, or public-sector requirements. Don't accept a certification logo as proof that your specific cage, network path, or process is covered.
A vendor-neutral advisor earns its place when multiple carriers, cloud providers, colocation operators, security vendors, and internal teams must be evaluated together. Data center brokerage services can support structured comparisons, but the client still needs to own the requirements, risk acceptance, and final commercial decision.
Commissioning, Acceptance, and the Grid Reality Check
A design that hasn't been commissioned is a set of assumptions. The project manager should require integrated systems testing across normal operation, maintenance states, utility loss, generator transfer, UPS behavior, cooling failure, network-path loss, alarm escalation, and recovery. Acceptance evidence should include test scripts, observed results, exceptions, corrective actions, and named signatories.
Use this handoff checklist:
- Validate capacity: Confirm electrical, cooling, network, and physical capacity against measured or tested load.
- Inject failures: Test single-component faults, shared dependencies, transfer sequences, and maintenance bypasses.
- Prove control: Verify alarms, access, change procedures, emergency response, and operator runbooks.
- Check the schedule: Reconcile utility milestones, permits, interconnection studies, fuel strategy, storage, and phased energization.
- Protect portability: Keep workloads movable if grid delivery, construction, or commissioning slips.
Grid readiness deserves an explicit go or no-go decision. In major U.S. markets, grid connections can take three to four years, and up to seven years in Northern Virginia. Only about 5 GW of the 16 GW of U.S. data-center capacity announced for 2026 was reportedly under construction, while proposed U.S. data-center power requests exceeded 700 GW, more than ten times estimated current consumption. (Power Engineering analysis of data-center construction delays)
Those figures expose the central risk: a utility request isn't deliverable capacity. Require schedule confidence, phased power options, on-site generation and storage analysis, emissions review, and workload portability before approving the site.
MR2 Solutions helps organizations evaluate data center, colocation, hybrid, and cloud strategies, compare providers, and align infrastructure choices with resilience, security, and business requirements. If your project needs a vendor-neutral assessment from requirements through implementation governance, visit MR2 Solutions to start the conversation.